Tron (TRX) continued its short-term recovery this week, posting steady gains across Monday and Tuesday, but momentum indicators suggest caution as technical signals begin to conflict.
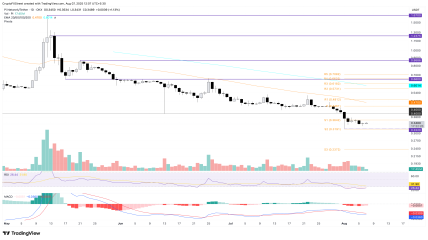
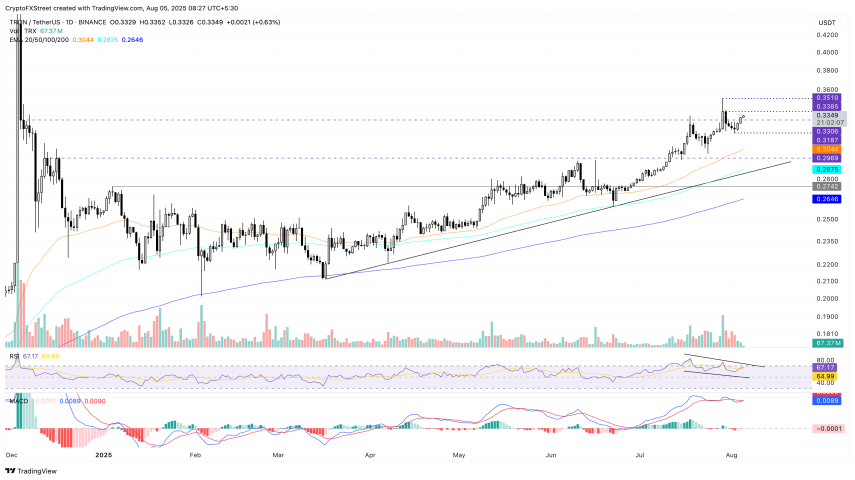
The token rose 1.62% on Monday, followed by a 1% increase on Tuesday, building on a V-shaped reversal that began with a morning star candlestick pattern last week at the $0.3187 low.
Currently, Tron is attempting to reclaim higher levels, with $0.3385 marked as a near-term resistance. A clean break above this zone could push TRX toward the $0.3510 high from the previous week.
⚠️ Momentum Signals Raise Caution
Despite the upward price action, some momentum indicators hint at weakening bullish strength:
The Relative Strength Index (RSI) has started to decline below the overbought threshold, despite TRX price climbing. This creates a bearish RSI divergence, often interpreted as a potential reversal signal.
Meanwhile, the Moving Average Convergence Divergence (MACD) is showing signs of indecision, as the MACD line trends sideways along its signal line — a sign of increasing volatility and unclear momentum.
“The price is rising, but momentum is lagging — a classic divergence scenario that often leads to short-term corrections,” a market analyst noted.
🔻 Support Zone to Watch: $0.3187
If TRX fails to maintain upward pressure, a pullback toward the $0.3187 support level could be triggered, potentially wiping out the recent gains. This would reaffirm the level as a critical short-term floor for bulls to defend.
📈 Key Levels
Resistance 1: $0.3385
Resistance 2: $0.3510
Support: $0.3187
🧭 Outlook
The short-term trend for Tron remains cautiously bullish but is increasingly fragile. Traders should monitor RSI and MACD behavior closely, with $0.3385 acting as the next key breakout test. Failure to hold recent gains could invite renewed bearish pressure.