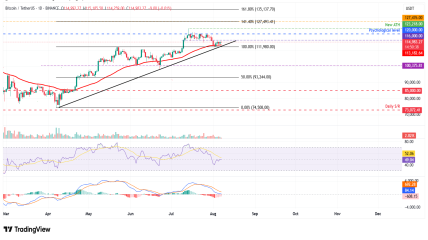
Bitcoin (BTC) continues to show signs of weakness after failing to close above the key resistance level at $116,000 earlier this week. Despite a short-lived recovery attempt from the 50-day Exponential Moving Average (EMA) support at $113,068 on Sunday, BTC faced a mild rejection at the resistance level on Tuesday and is now trading below $114,000 as of Wednesday.
This latest movement suggests a growing bearish sentiment in the market, especially if Bitcoin fails to maintain support above its 50-day EMA.
Key Technical Support: 50-Day EMA at $113,068
The 50-day EMA currently serves as Bitcoin’s primary short-term support. If the price breaks below this level and closes beneath it on the daily chart, BTC could slide further to retest the previous all-time high of $111,980. A decisive move below that level could trigger a deeper correction, with the next psychological support lying around $110,000.
This zone ($110,000–$112,000) is critical — a failure to hold here could shift market sentiment further to the downside and invite increased selling pressure.
Technical Indicators Confirm Downside Momentum
On the daily chart:
Relative Strength Index (RSI):
RSI currently reads 45, after being rejected from the neutral 50 level on Monday. This indicates fading bullish momentum and strengthening bearish pressure.
Moving Average Convergence Divergence (MACD):
A bearish crossover that occurred on July 23 remains intact, signaling the continuation of negative momentum. As long as this crossover persists, downside risks are likely to dominate the near-term outlook.
Can Bitcoin Hold the Line?
Although the technical picture appears bearish at the moment, all is not lost for the bulls. If Bitcoin can sustain support at or above the 50-day EMA, it may attempt another move toward $116,000 resistance. However, this would likely require renewed bullish momentum or a shift in market sentiment driven by fundamentals or external catalysts.
In that scenario, a break and daily close above $116,000 could open the door for a larger bullish recovery — but until then, caution remains warranted.
Short-Term Outlook Summary:
Indicator Signal
Key Support Levels $113,068 (50-day EMA), $111,980, $110,000
Resistance Level $116,000
RSI 45 (bearish bias)
MACD Bearish crossover since July 23
Market Bias Bearish unless support holds and $116K is breached
Conclusion:
Bitcoin is currently at a crossroads. A failure to hold the 50-day EMA could accelerate downside momentum and drag BTC below $112K toward the $110K psychological level. On the other hand, holding this support may provide enough strength for another attempt to challenge the $116K barrier.
For now, traders and investors should monitor price action closely and exercise caution, especially in the short term. Momentum indicators are leaning bearish, and key support levels are under threat.
Disclaimer:
This analysis is for informational purposes only and does not constitute financial advice. Always conduct your own research or consult with a qualified financial advisor before making investment decisions.