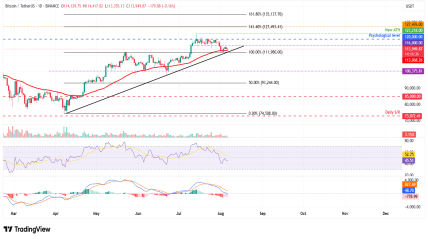
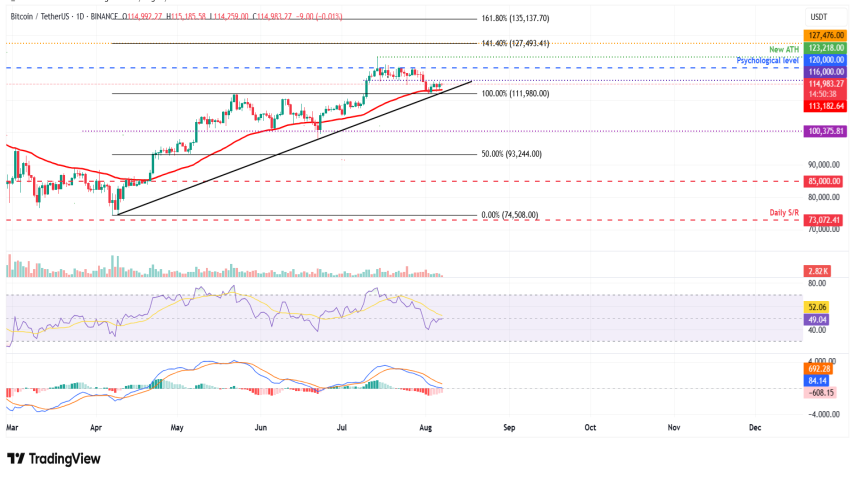
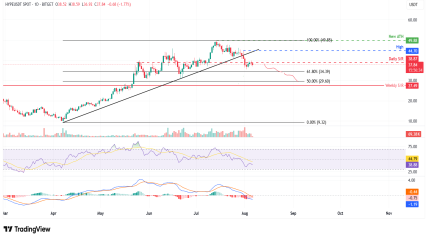
Bitcoin (BTC) continues to trade within a tight consolidation range following its recent correction. After closing below the key support level of $116,000 at the end of July, BTC dipped nearly 3% over the next two days, briefly retesting its 50-day Exponential Moving Average (EMA) around $113,182 — a level that also aligns with the former all-time high of $111,980, making it a critical support zone.
As of Thursday, BTC has shown a modest recovery, currently hovering around $114,900.
🔍 Key Technical Insights:
Resistance to Watch: A daily close above $116,000 could open the door for a push toward the psychological milestone of $120,000.
Support to Monitor: A break below the 50-day EMA ($113,182) could trigger a deeper correction, likely targeting $111,980, the prior high from May 22.
📊 Indicator Overview:
Relative Strength Index (RSI):
Flattening near the neutral 50 level, suggesting trader indecision and low momentum in either direction.
MACD (Moving Average Convergence Divergence):
Remains bearish, having crossed over on July 23, and has yet to signal any bullish reversal.
🧠 Conclusion:
Bitcoin is at a critical decision point. A strong move above $116K could reignite bullish momentum, while a failure to hold above the 50-day EMA may lead to further downside pressure. Traders should watch for volume confirmation and daily candle closes around these levels before making directional bets.